
Risks linked to a high BMI
- High blood pressure and elevated LDL cholesterol
- Type 2 diabetes
- Coronary heart disease and stroke
- Osteoarthritis and joint strain
- Sleep apnea and breathing difficulty
Body Mass Index (BMI) divides weight in kilograms by height in metres squared to produce a single screening number for weight status.
The World Health Organization sets adult BMI cut-off points at 18.5, 25, 30, 35 and 40 kg/m². These ranges apply to both men and women aged 20 and above.
| Classification | BMI Range (kg/m²) |
|---|---|
| Severe Thinness | Below 16 |
| Moderate Thinness | 16 to 17 |
| Mild Thinness | 17 to 18.5 |
| Normal | 18.5 to 25 |
| Overweight | 25 to 30 |
| Obese Class I | 30 to 35 |
| Obese Class II | 35 to 40 |
| Obese Class III | Above 40 |
BMI uses two formulas depending on the unit system. Both produce the same result for a given height and weight.
| Unit System | Formula |
|---|---|
| Metric | BMI = weight (kg) ÷ height² (m) |
| Imperial | BMI = 703 × weight (lb) ÷ height² (in) |
Find your height and weight in the grid below. Each cell shows the resulting BMI, colour coded by category.
| Height \ Weight | 40kg | 50kg | 60kg | 70kg | 80kg | 90kg | 100kg | 110kg | 120kg |
|---|---|---|---|---|---|---|---|---|---|
| 150cm | 18 | 22 | 27 | 31 | 36 | 40 | 44 | 49 | 53 |
| 160cm | 16 | 20 | 23 | 27 | 31 | 35 | 39 | 43 | 47 |
| 170cm | 14 | 17 | 21 | 24 | 28 | 31 | 35 | 38 | 42 |
| 180cm | 12 | 15 | 19 | 22 | 25 | 28 | 31 | 34 | 37 |
| 190cm | 11 | 14 | 17 | 19 | 22 | 25 | 28 | 30 | 33 |
| 200cm | 10 | 13 | 15 | 18 | 20 | 23 | 25 | 28 | 30 |
Health organisations such as the CDC and WHO associate both high and low BMI ranges with specific risks. BMI is a screening indicator here, not a diagnosis.
BMI measures excess weight, not excess body fat, so it does not separate muscle mass from fat mass. A muscular or highly active individual can register a high BMI while carrying low body fat, and an inactive individual can register a normal BMI while carrying high body fat. BMI is generally reliable for 90 to 95% of adults but is less accurate for athletes, older adults, and pregnant women.
A BMI calculation is only as good as the number you put into it. A half kilogram error barely shifts the result, but for someone following a nutritionist's weekly targets, recovering weight after an illness, or working toward a doctor set goal, that same half kilogram is the difference between "on track" and "off track."
Some people weigh in daily as part of a structured diet plan. Others are trying to gain weight back after being underweight, or keeping an eye on a health condition where sudden changes matter. A few just want one honest number they can trust week to week, without wondering if the scale itself is the problem.
Whatever the reason, the accuracy has to come from the scale before it can come from the math.
Someone on a nutritionist directed plan tracks weekly weight against a target BMI range, adjusting the diet as the number moves.
A person advised to gain weight after being underweight tracks progress toward the lower edge of the normal BMI range, month over month.
A gym goer with high muscle mass often lands in "overweight" on BMI alone, so they pair it with a body fat percentage reading for the full picture.
New mothers track weight changes over several months as part of postpartum recovery, alongside guidance from their doctor.
Many hospitals and insurers record BMI as a standard screening figure a doctor reviews alongside blood pressure and other vitals.
Pediatricians plot a child's BMI percentile over years, not as a single reading, to spot a growth trend that needs attention.
A healthy BMI for adults falls between 18.5 kg/m² and 25 kg/m², based on World Health Organization classification.
BMI can overestimate body fat in muscular individuals because the formula does not distinguish muscle mass from fat mass.
No. The CDC uses age and gender specific BMI percentiles for children aged 2 to 20, not the fixed adult cut-offs.
Track your weight on an accurate scale over time and consult a doctor before making significant lifestyle changes.
Checking weight weekly and recalculating BMI monthly gives a stable trend without over-focusing on daily fluctuations.
Individually calibrated personal and smart scales from Omace.
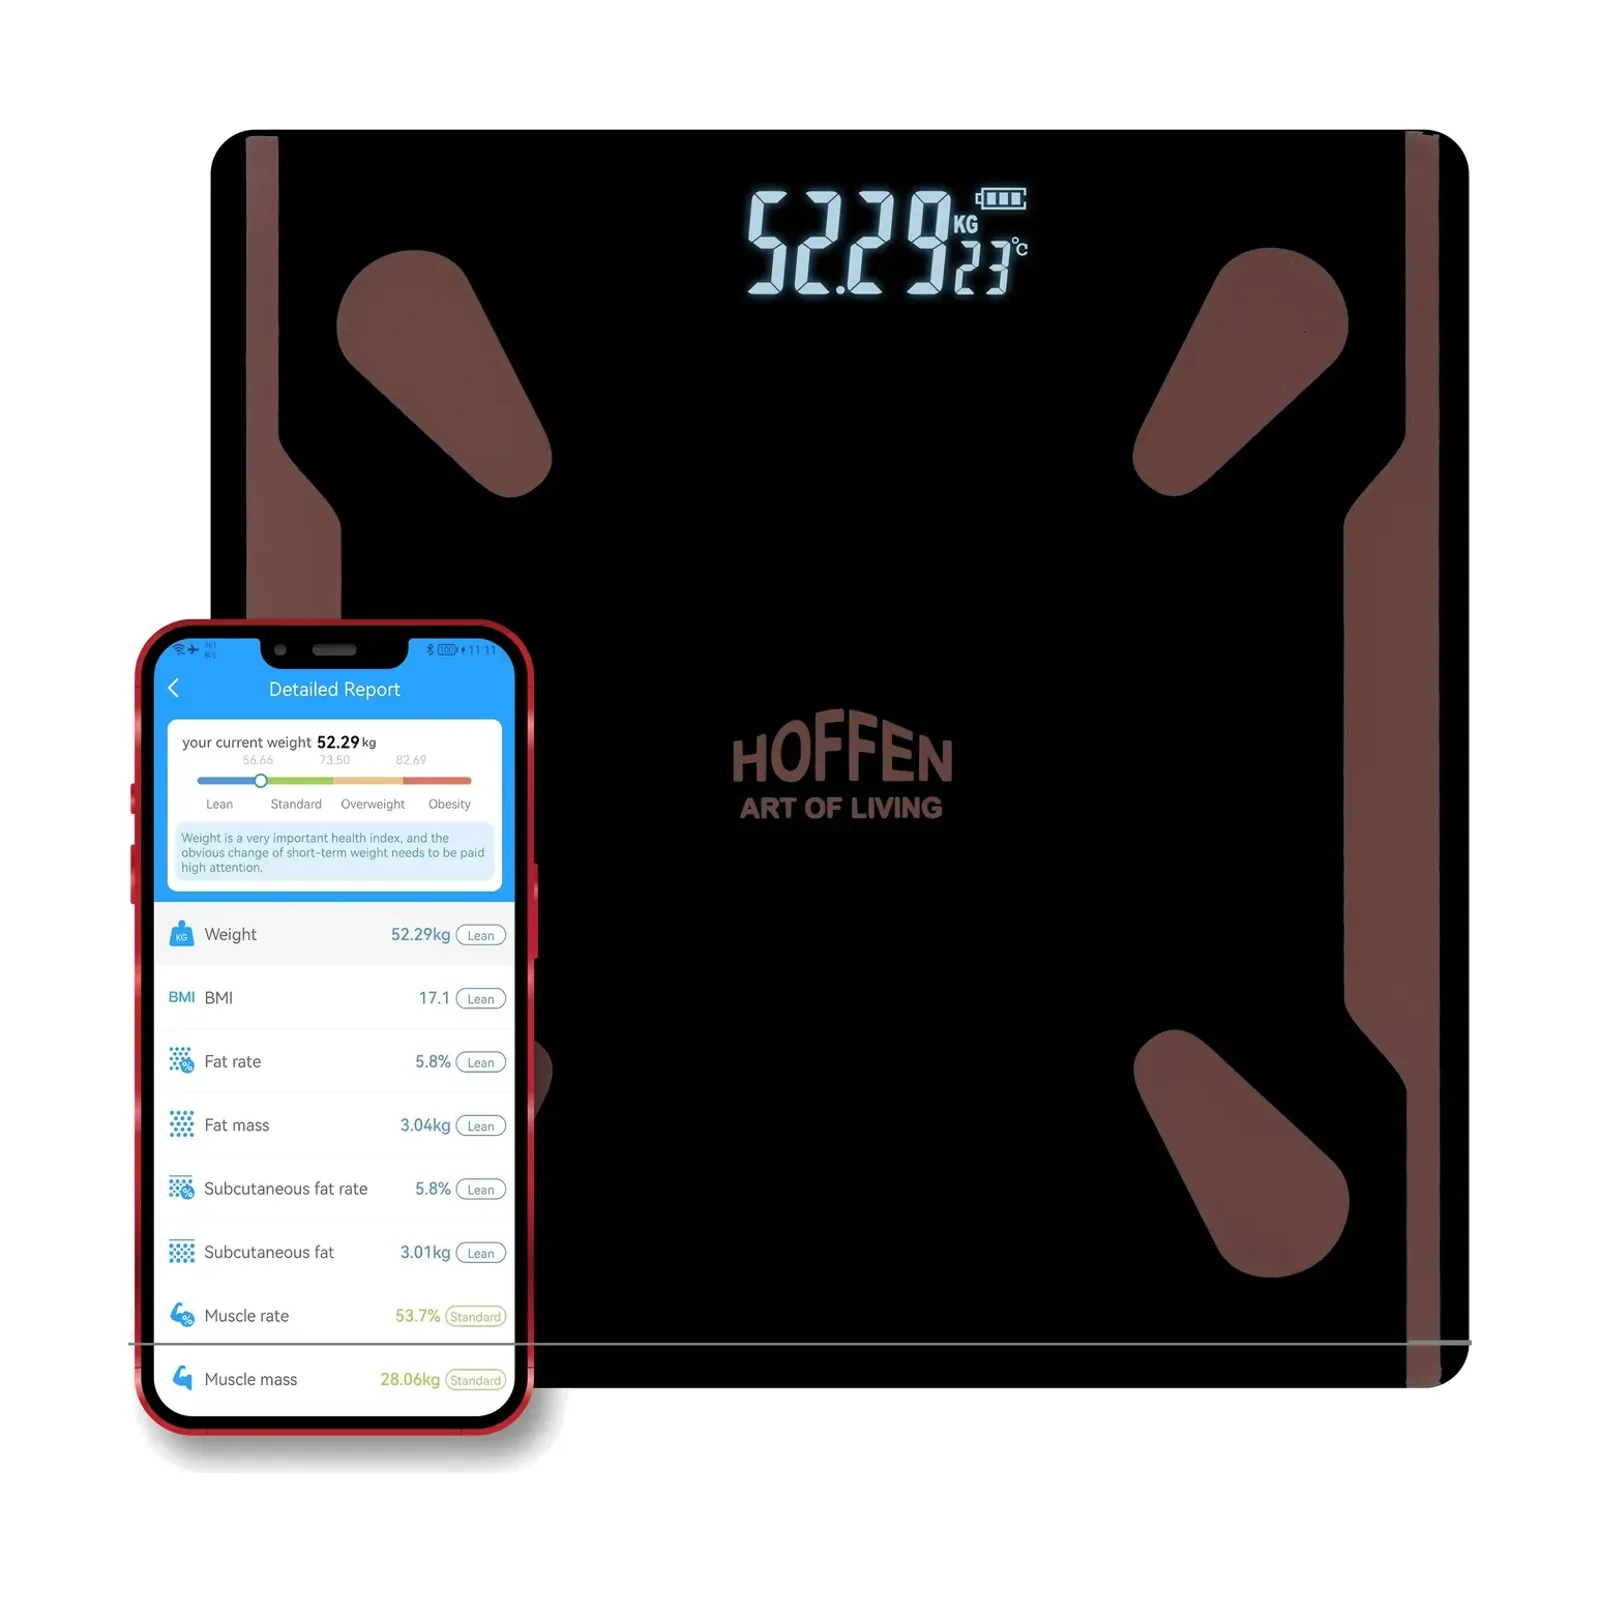 −77%
HO-9 BMI Weighing Machine, 25+ Body Metrics, App, Backlit LCD, 180 kg, Brown Pattern Glass
₹699M.R.P. ₹2,999You save ₹2,300
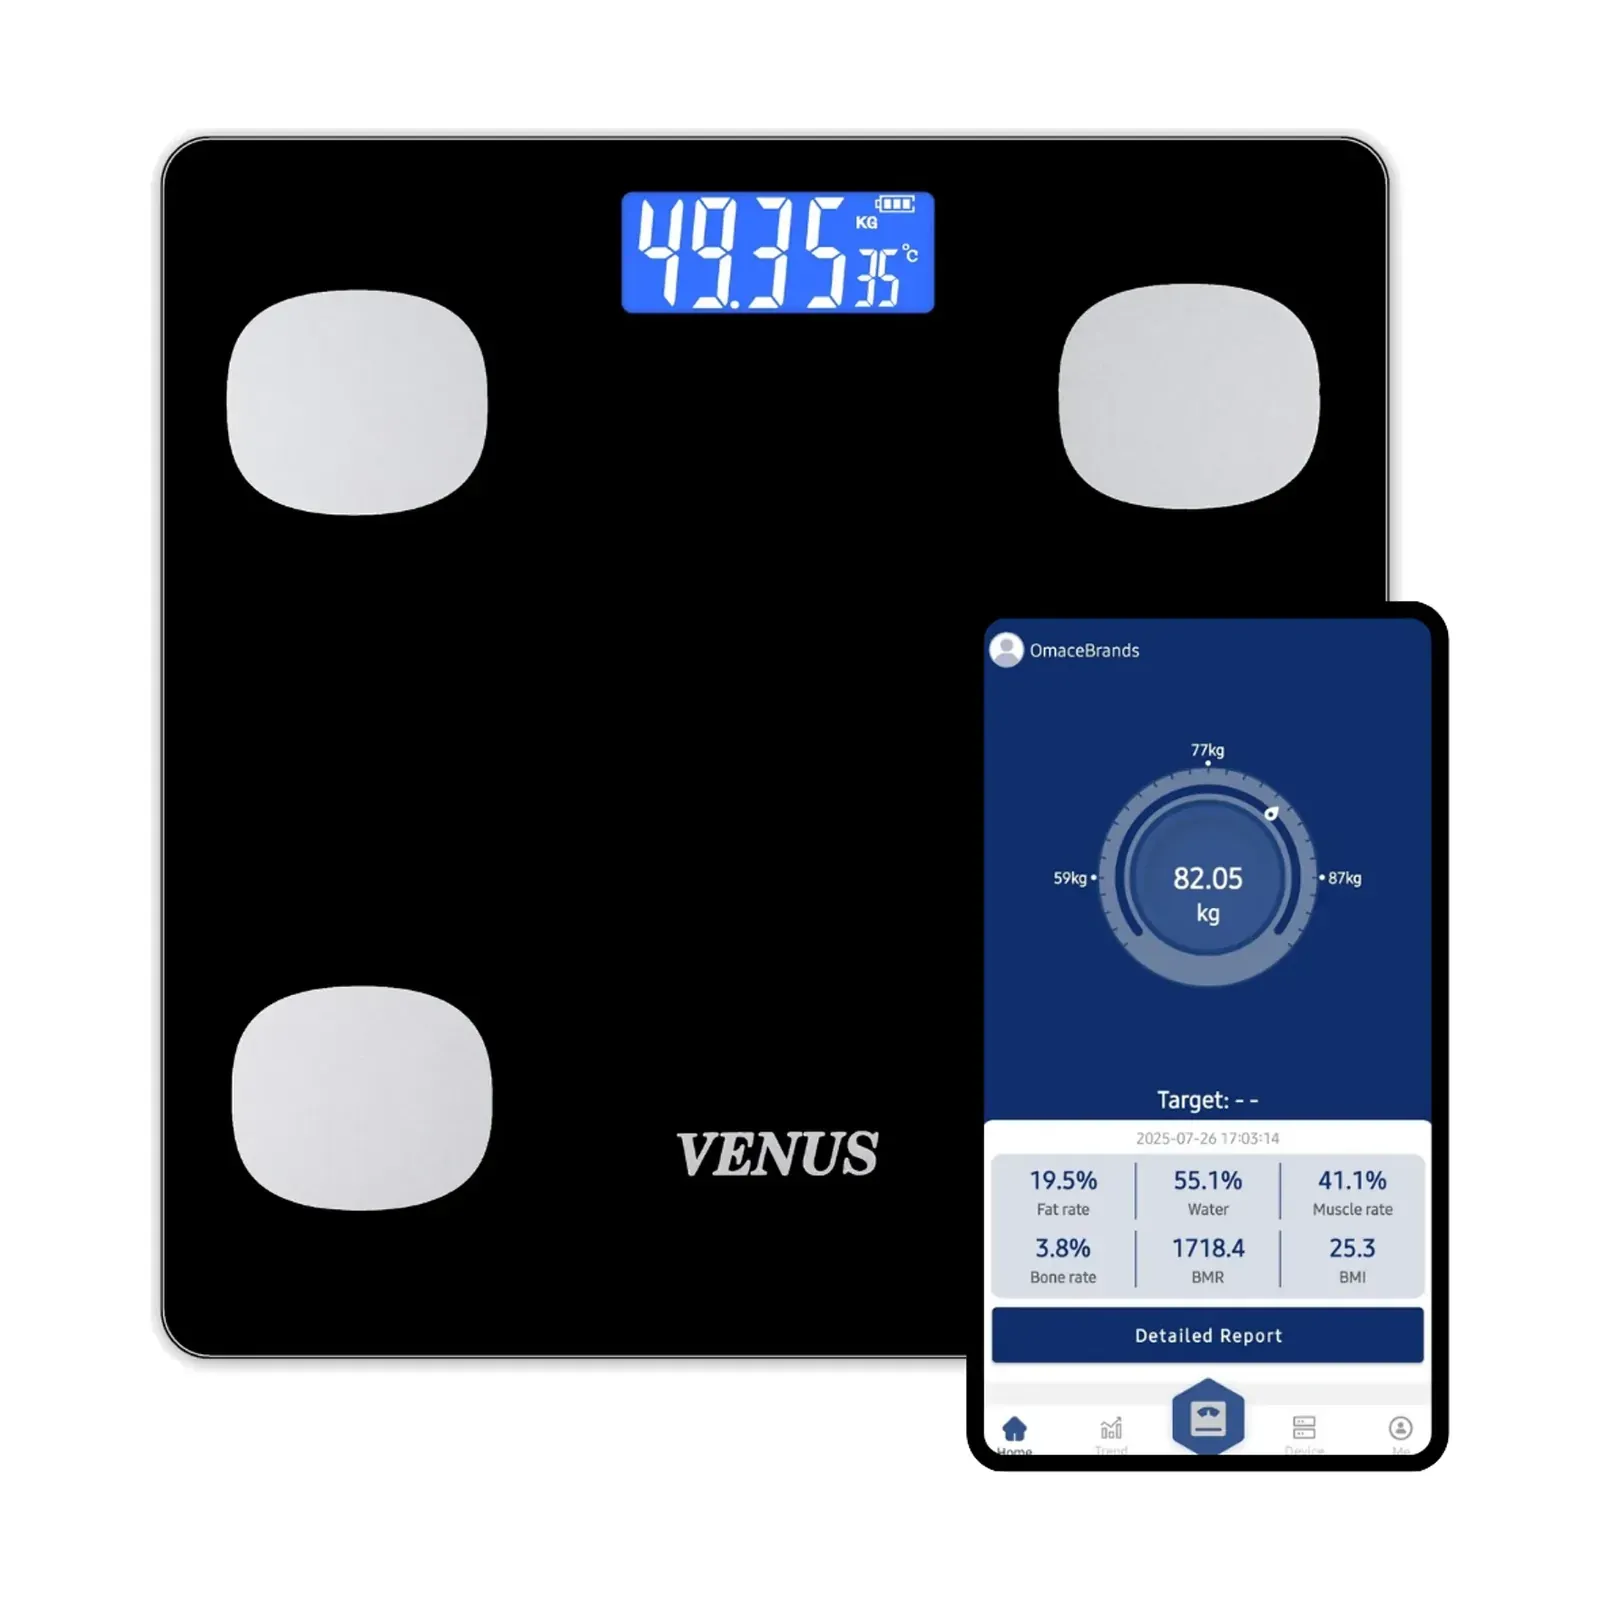 −77%
EPS-6399 Body Fat Weighing Machine, 25 Body Metrics, Omace Fit App, Made in India, 180 kg
₹699M.R.P. ₹2,999You save ₹2,300
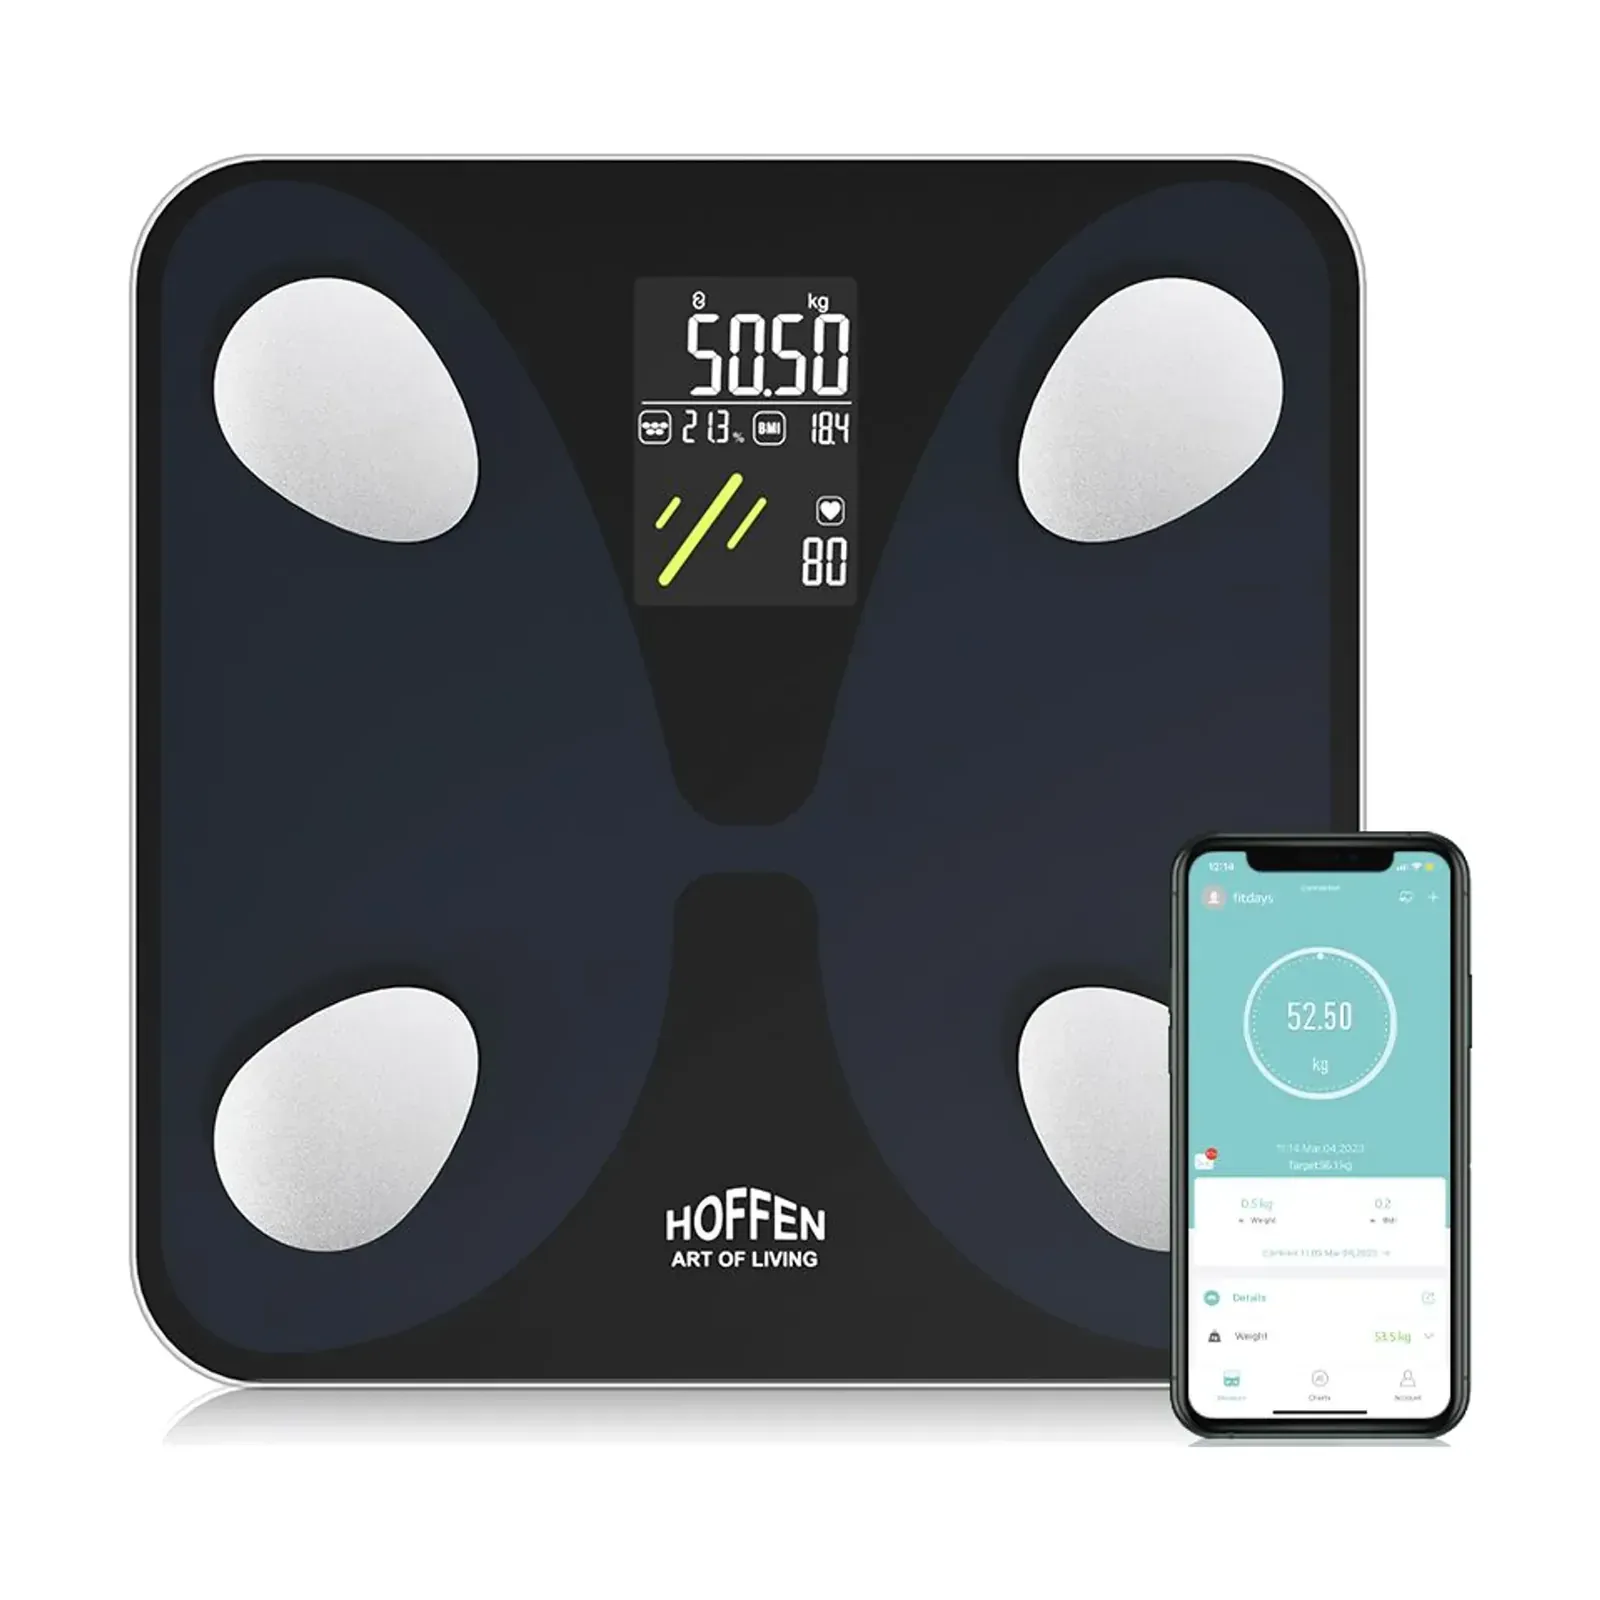 −50%
HO-45 Smart Body Composition Scale, 16 Body Measurements, Heart Rate, Colour VA Display, App
₹2,499M.R.P. ₹4,999You save ₹2,500
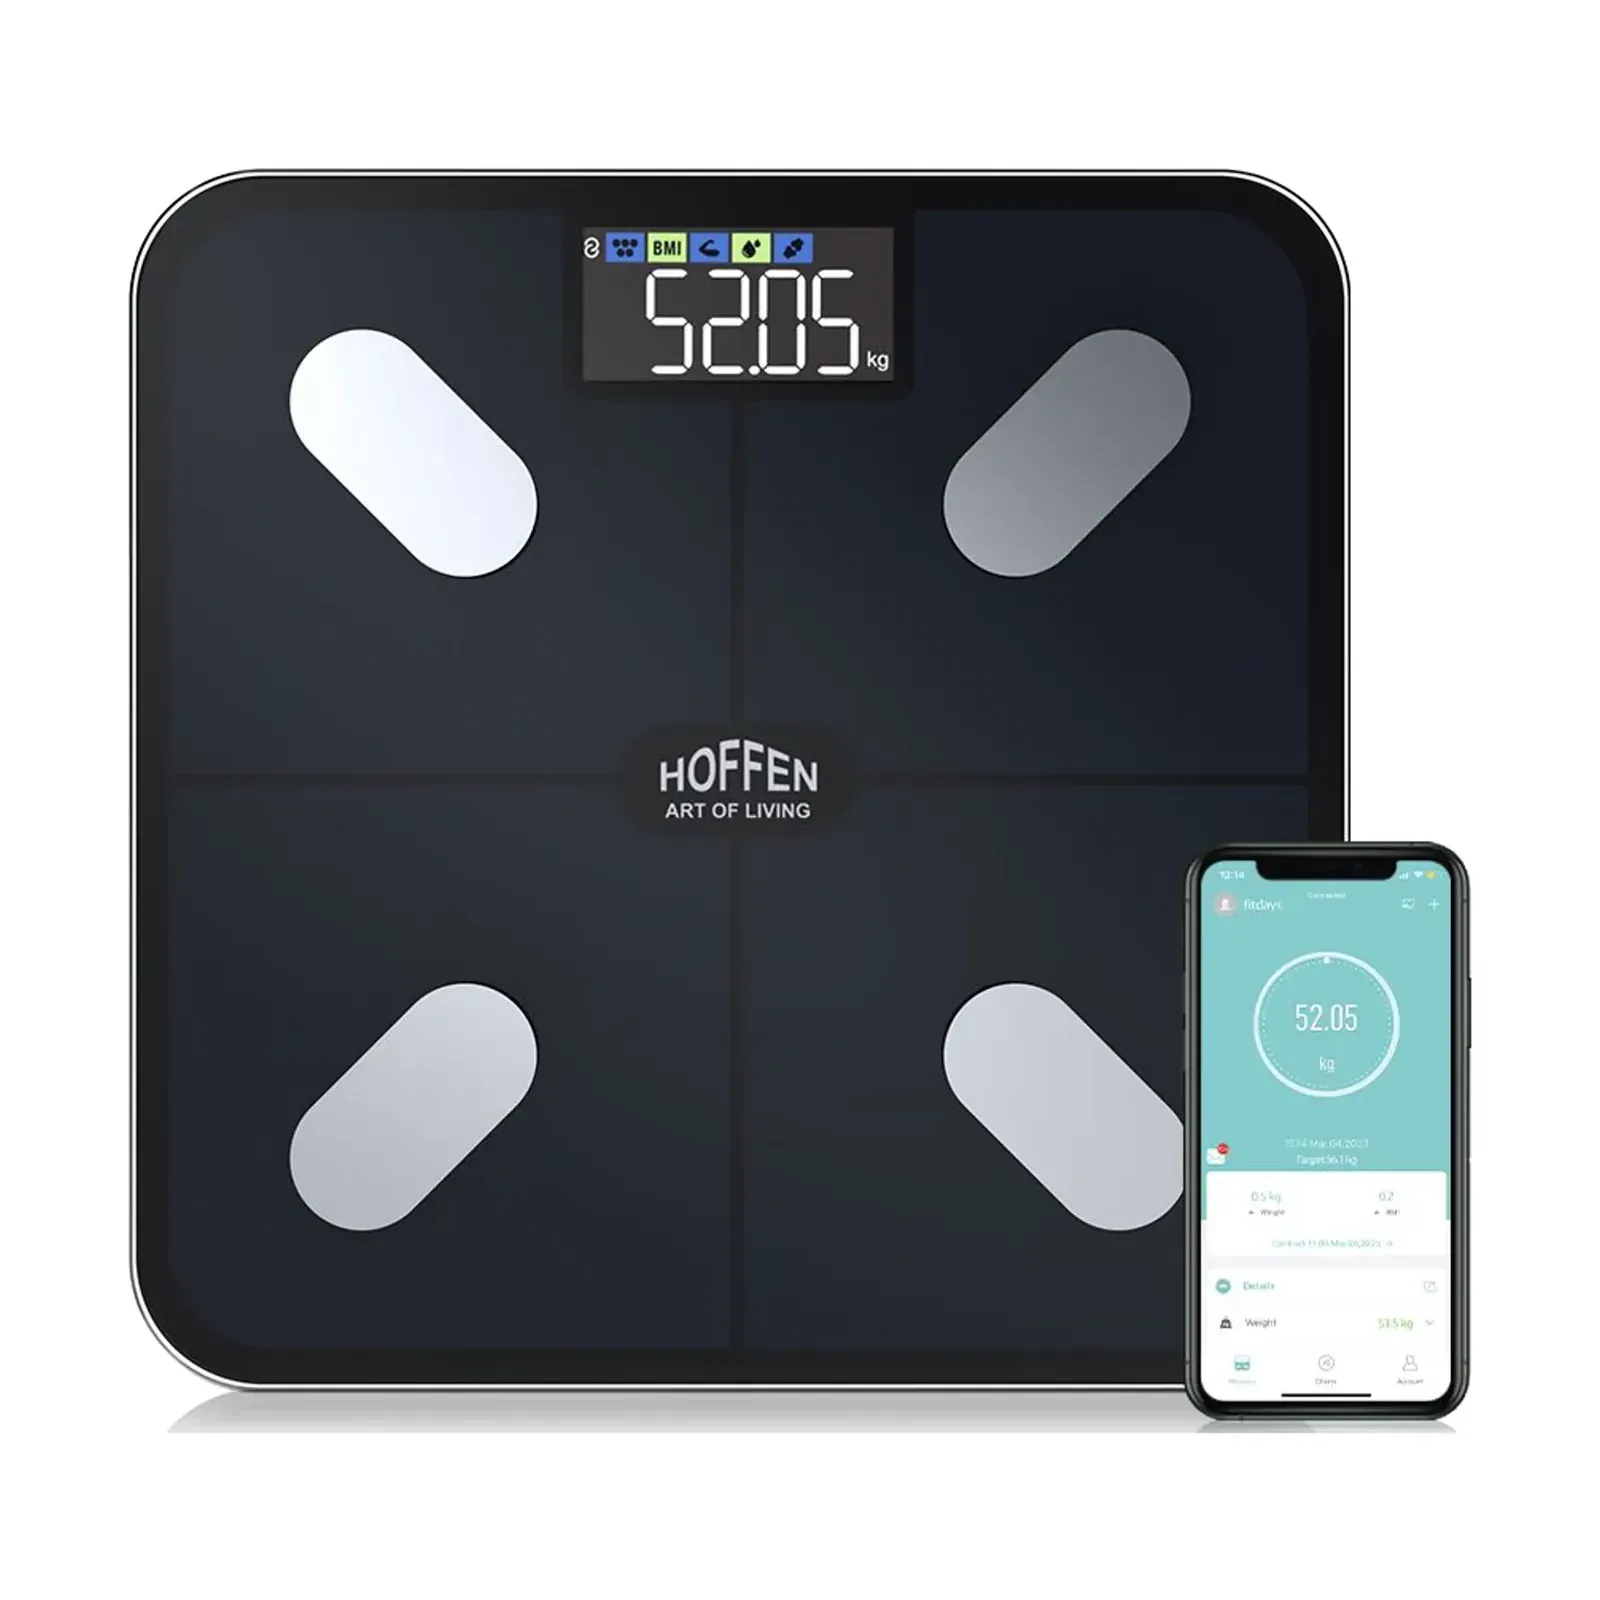 −67%
HO-36 Body Fat Analyzer Scale, 14 Body Measurements, Colour VA Display, Bluetooth App
₹1,499M.R.P. ₹4,499You save ₹3,000
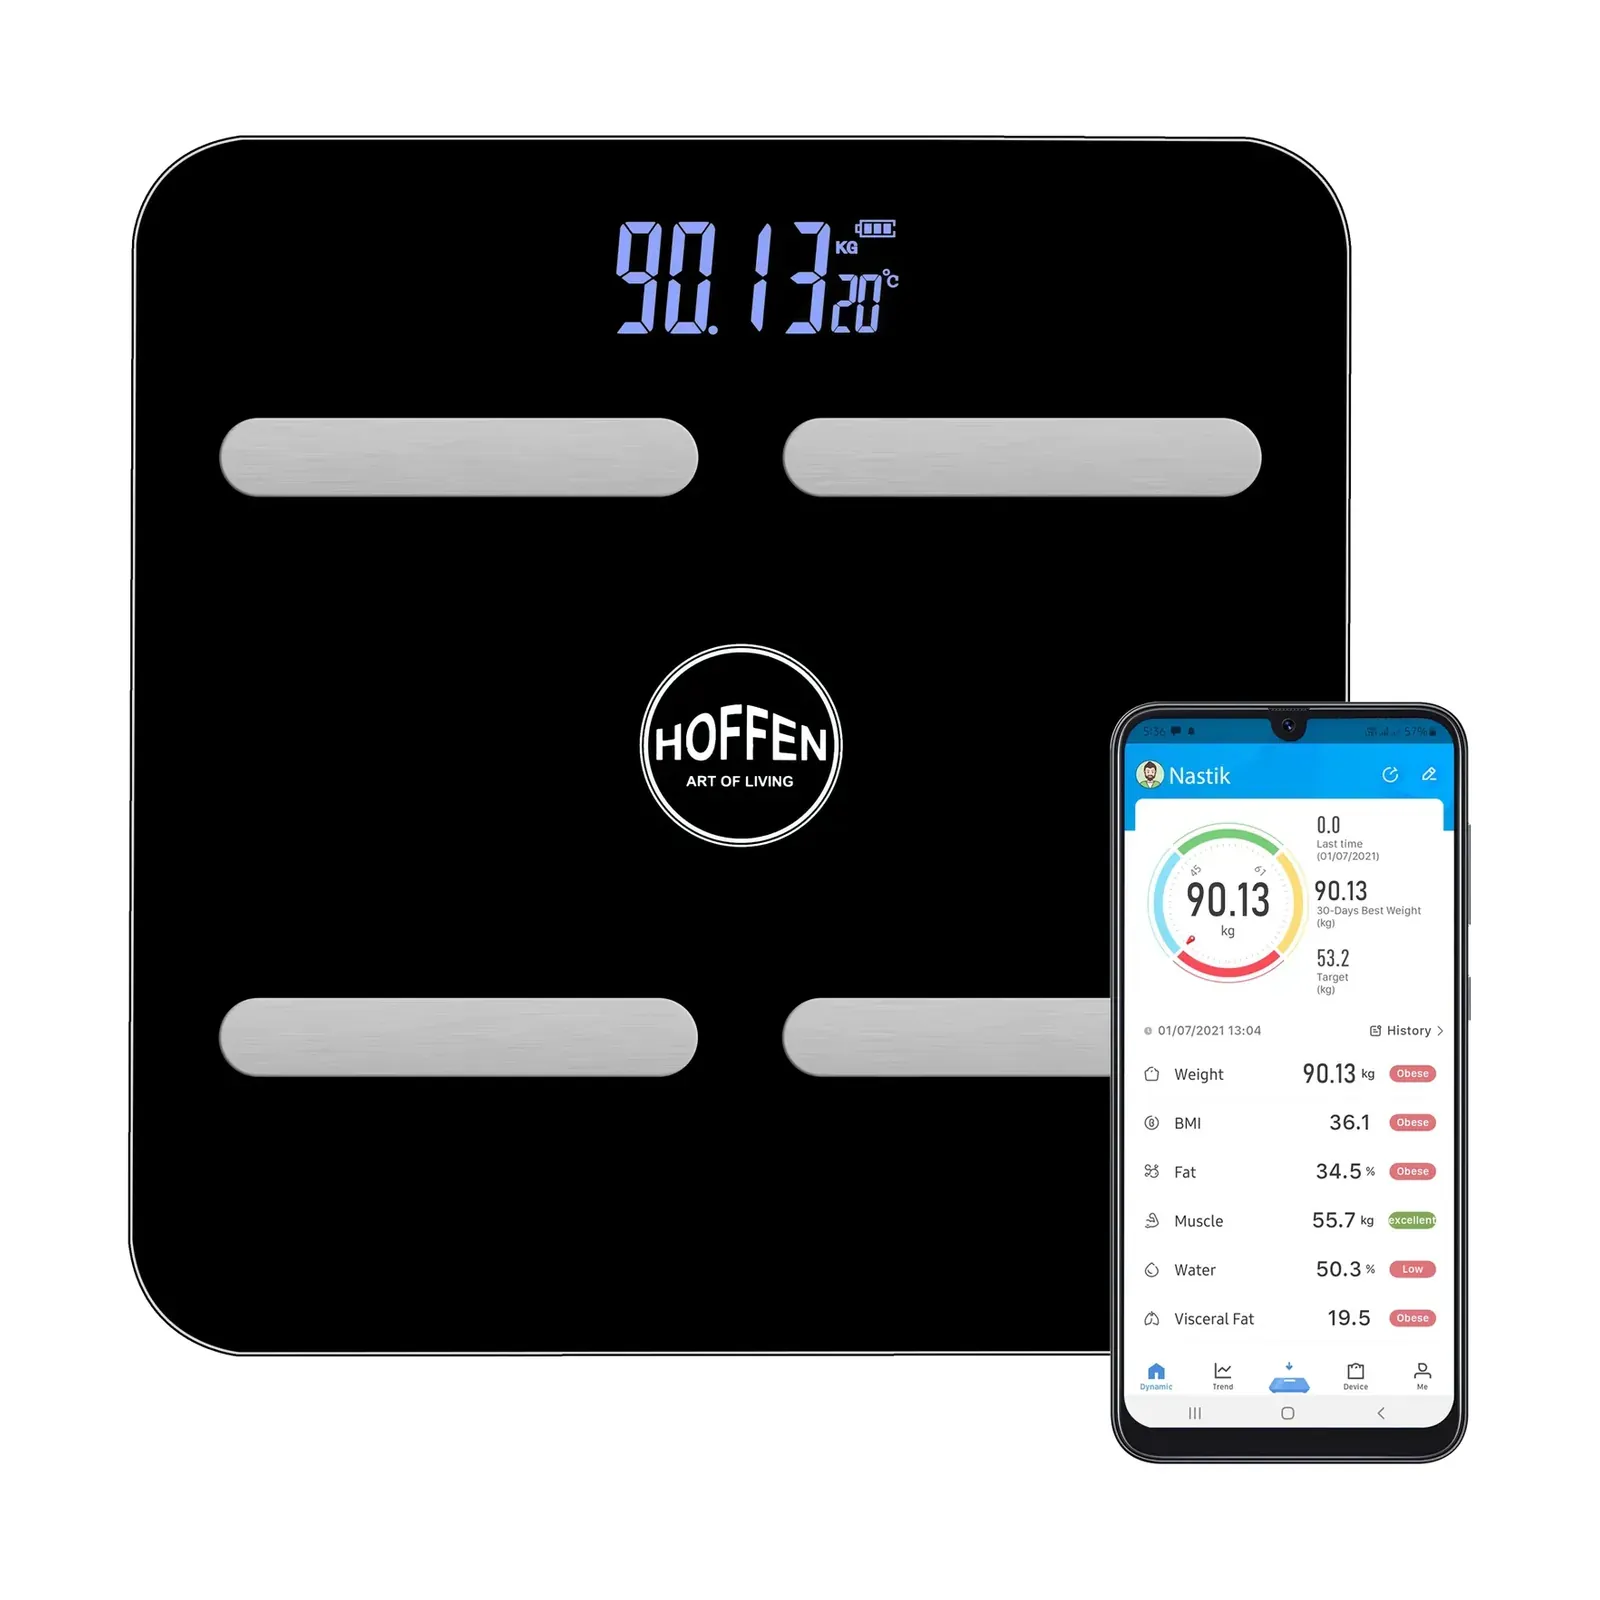 −73%
HO-18 Weight Machine with App, 15+ Body Measurements, Large LCD, Black Glass, 180 kg
₹799M.R.P. ₹2,999You save ₹2,200
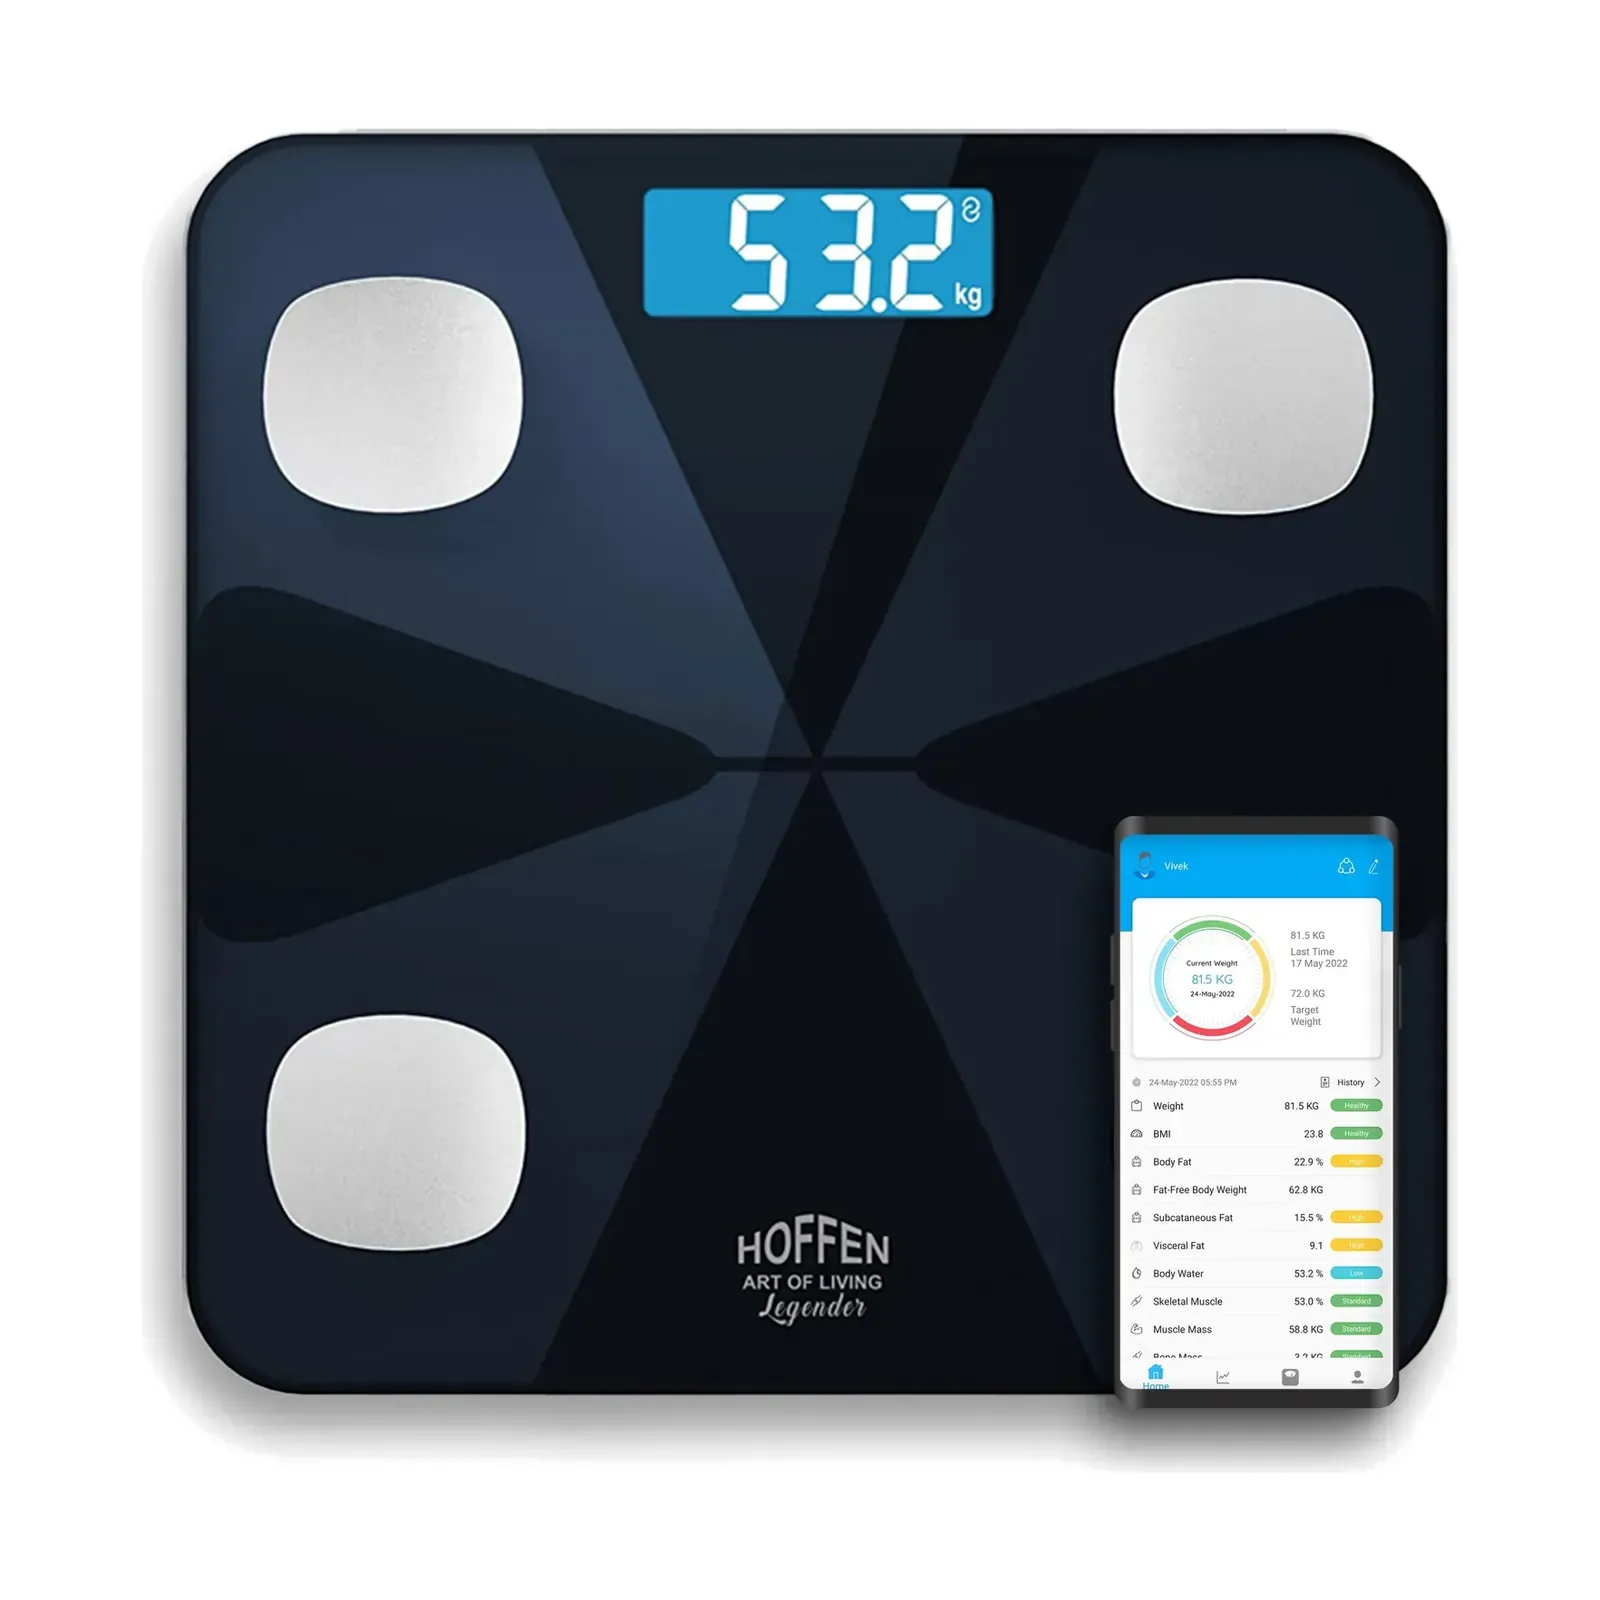 −78%
HO-19 Bluetooth Weighing Scale, 14 Body Measurements, FitDays App, Large LCD, 180 kg
₹899M.R.P. ₹3,999You save ₹3,100
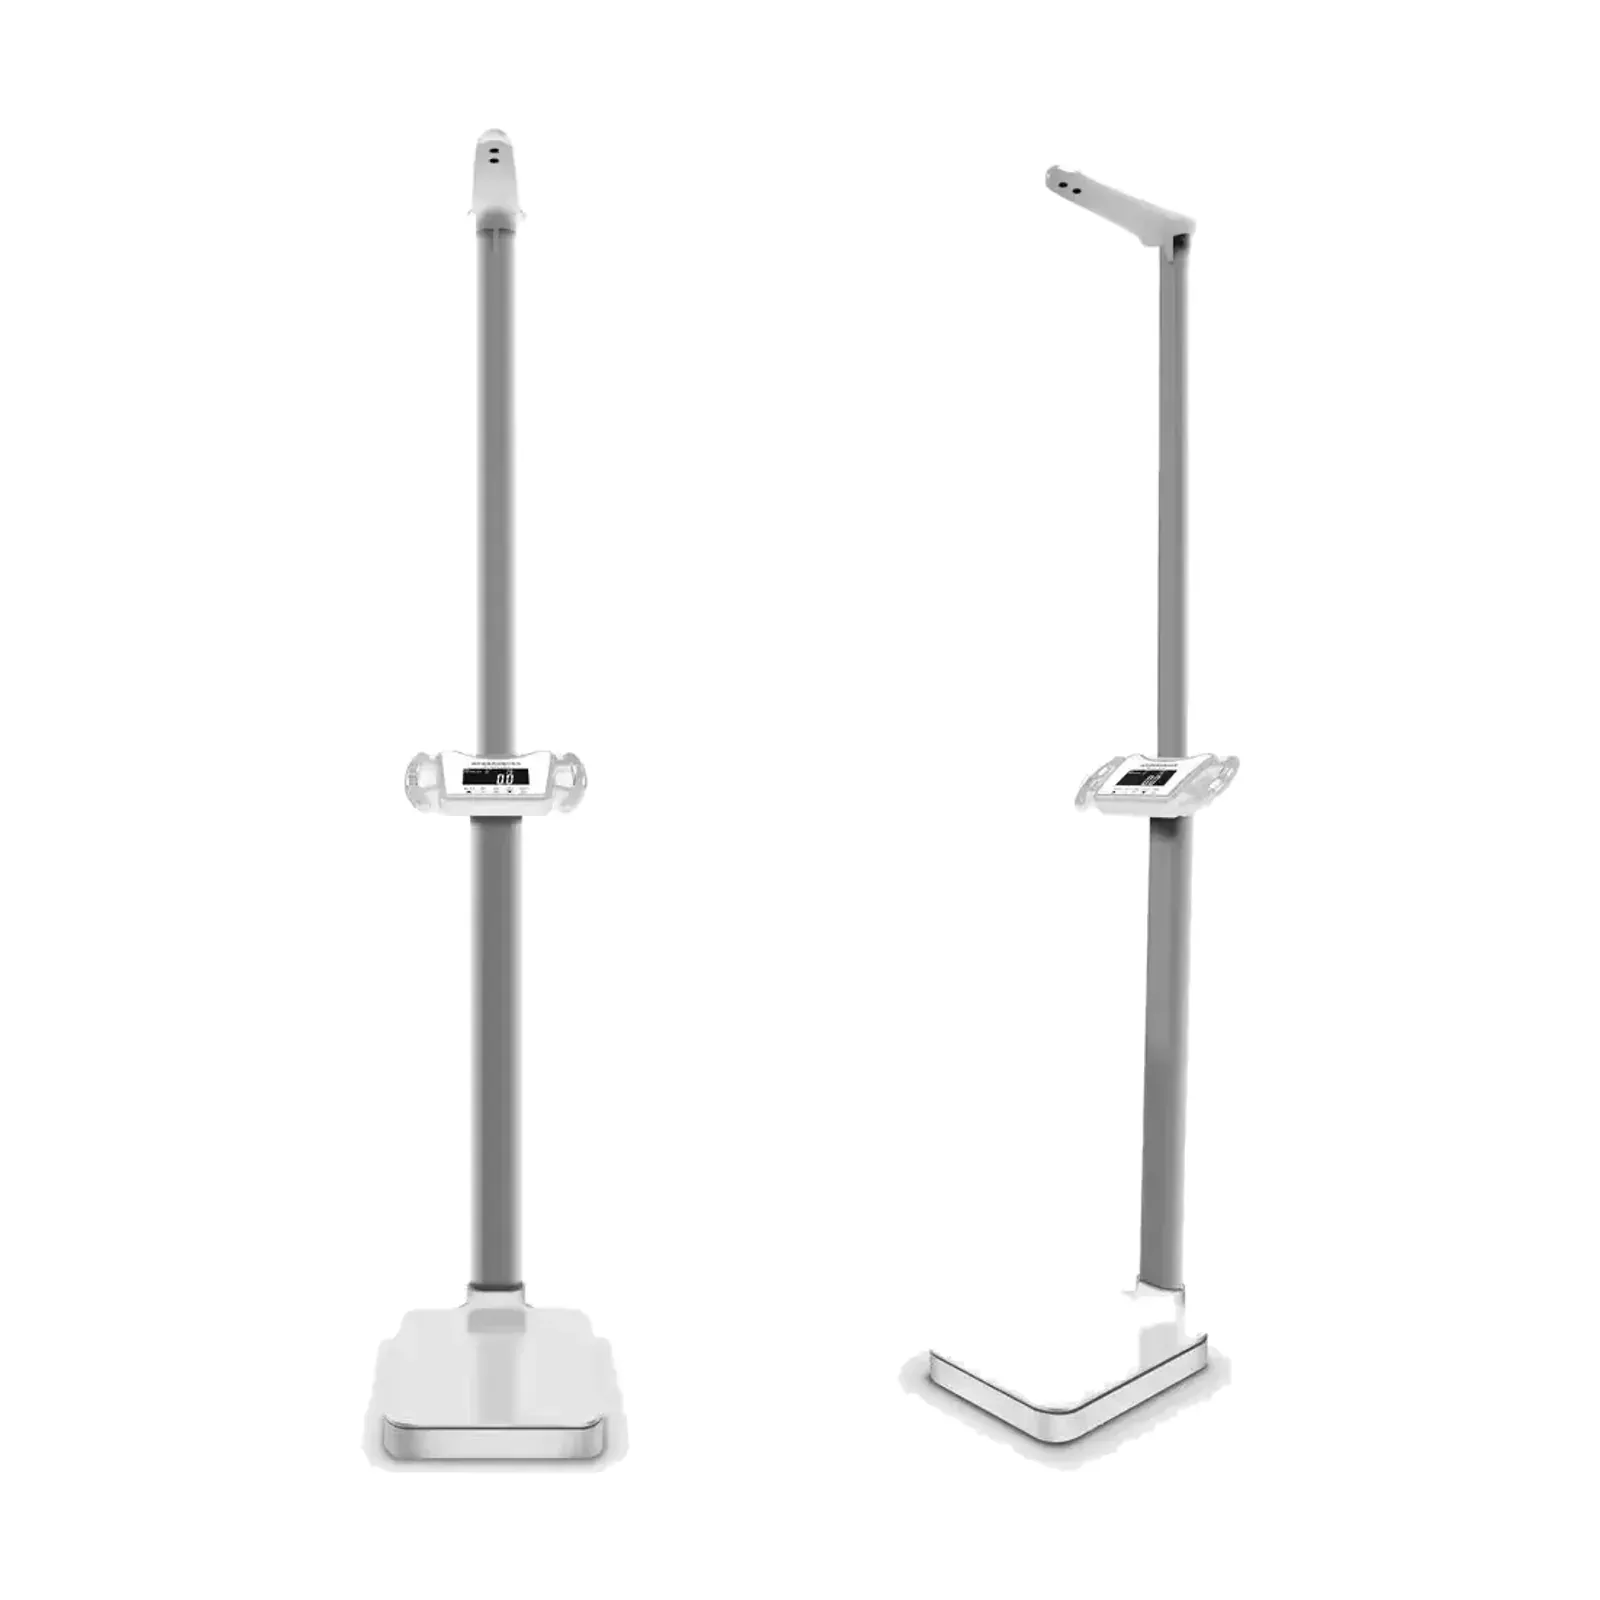 −11%
₹16,999M.R.P. ₹18,999You save ₹2,000