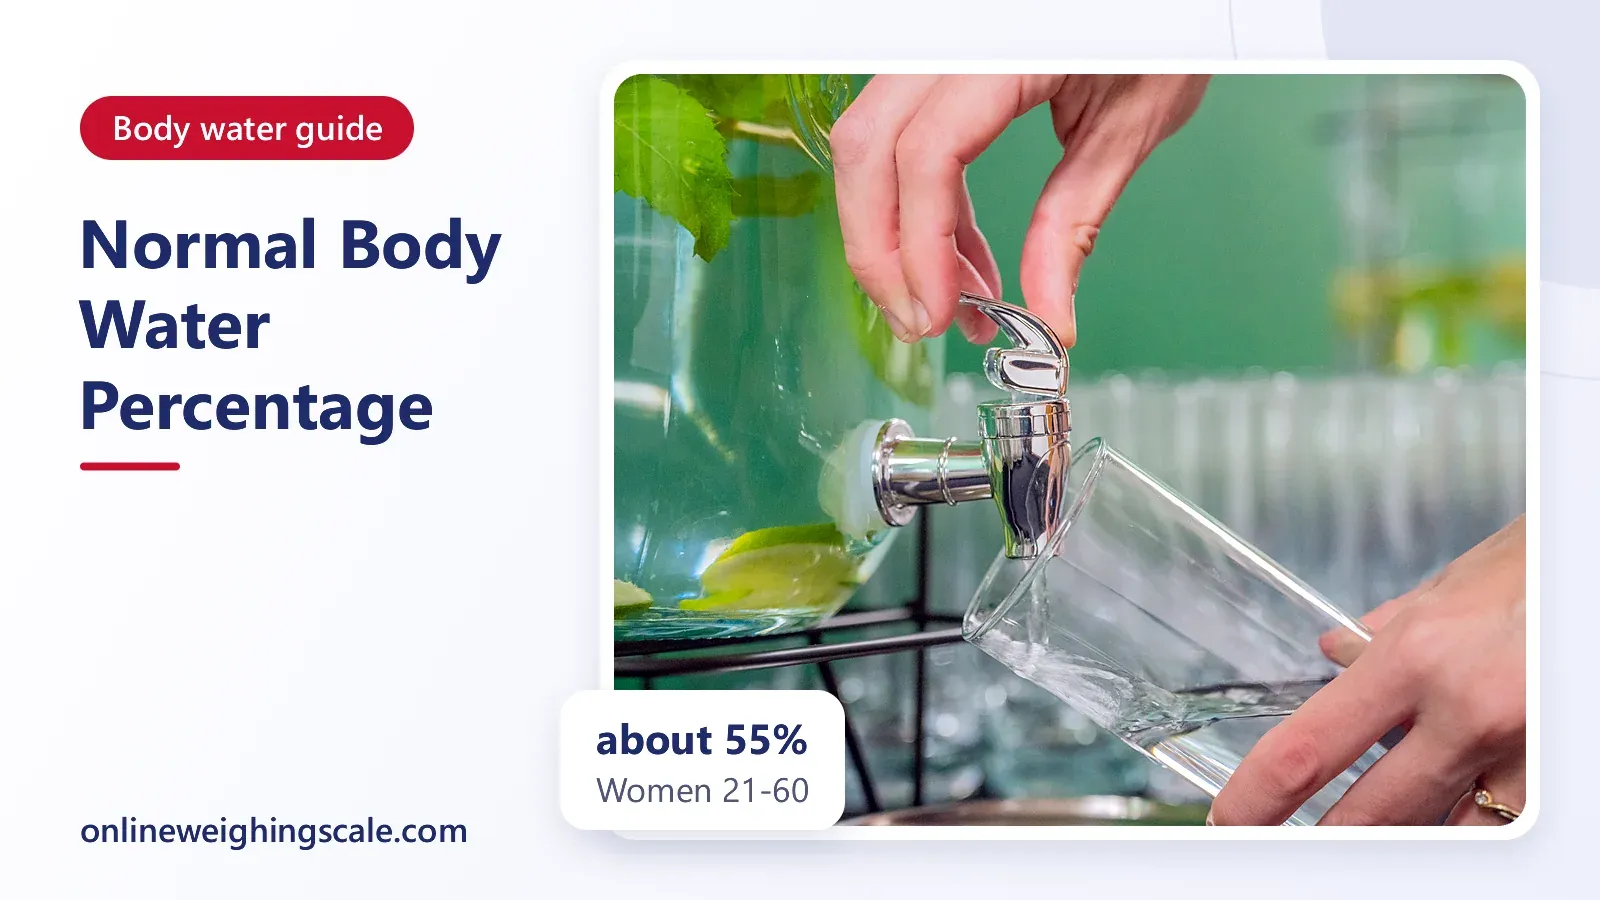
Body water percentage is the share of your body weight that is water. In one study of 545 people, normal-weight men and boys stayed near 62% from childhood into adult life, while women settled near 55%. This guide gives the ranges by age and sex, explains why the number moves during a day, and shows how a lab and a body composition scale each arrive at it.
What body water percentage means
Total body water is every litre of fluid inside you: the fluid in your cells, in the spaces between them and in your blood. Body water percentage divides that total by your body weight. A person weighing 70 kg with 40 kg of water has a body water percentage of about 57%.
Most of it sits inside cells. A 2018 paper on 3,451 adults in China, published in the journal Medicine, notes that in healthy adults about two-thirds of body water is held inside the cells. The rest is outside them. The same paper reports that the outside share rises with age, and it links that to more difficulty keeping fluid balance in older people.
Total body water is also not the same thing as being hydrated. It tells you how much water the body holds, not whether you drank enough today. A person can have a normal body water percentage and still be thirsty after a hot walk to the mandi.
Body water percentage by age and sex
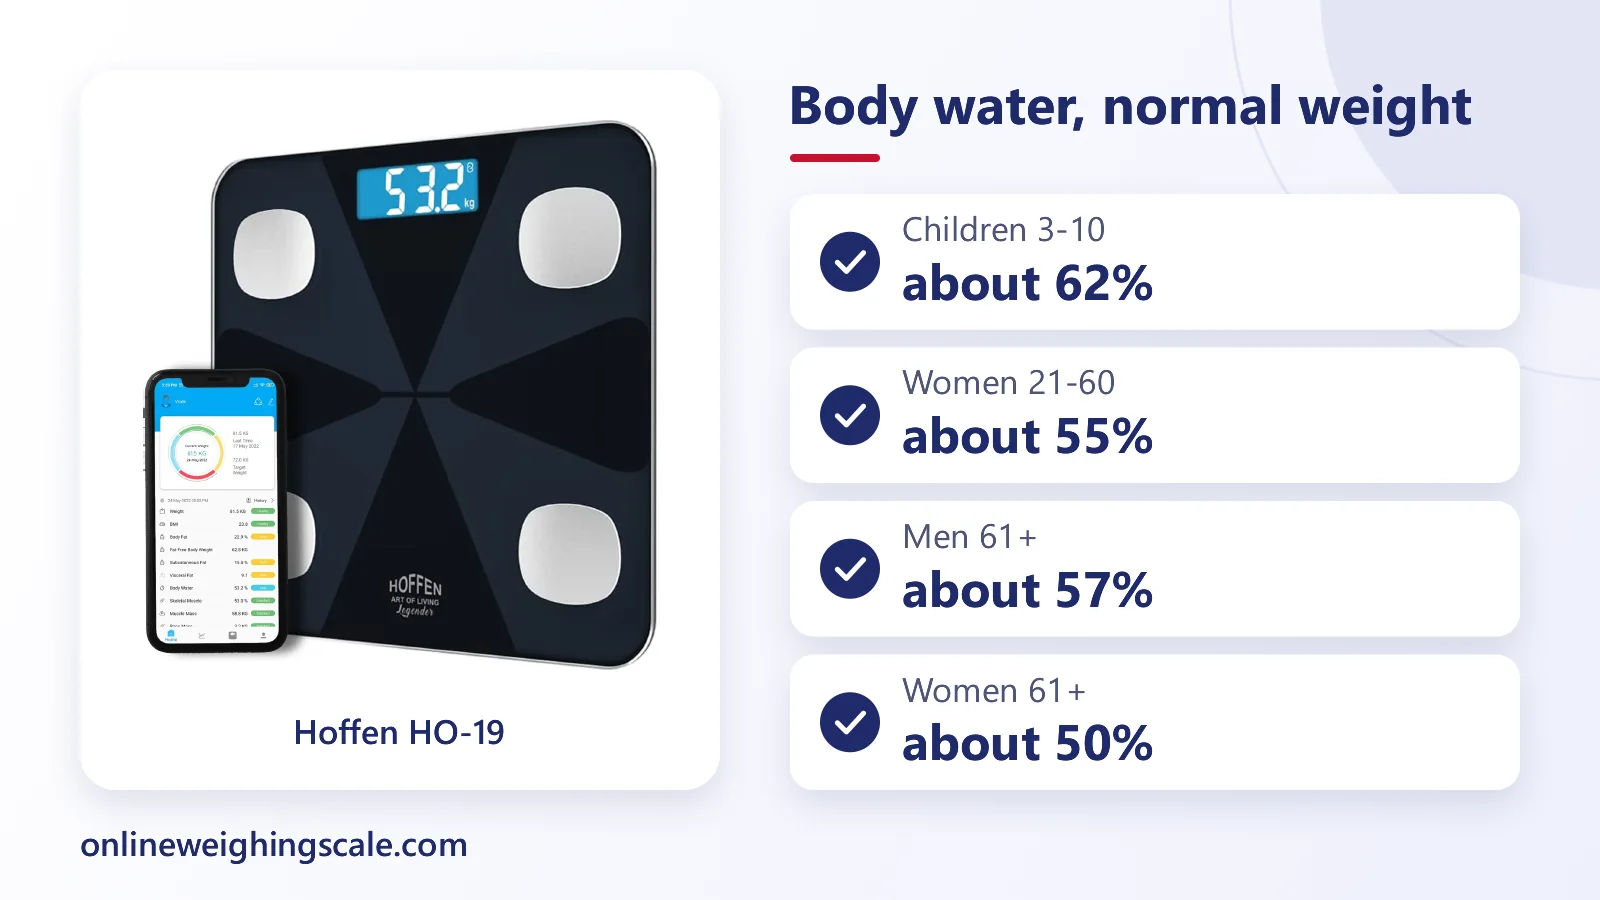
This guide uses one published study, since no single official chart of body water percentage for healthy adults was found. The numbers come from a 2023 paper in Kidney Research and Clinical Practice. The authors measured 545 people aged 3 to 98 and grouped them by age. The table shows what they found in people of normal weight.
| Age group | Boys and men | Girls and women |
|---|---|---|
| 3 to 10 years | about 62% | about 62% |
| 11 to 20 years | stays stable | about 55% |
| 21 to 60 years | stays stable | about 55%, roughly steady |
| 61 years and above | about 57% | about 50% |
Read the table as an average from one group of people, not a target. Another method, another country or another body type will give slightly different numbers. Individual healthy people fall above and below these averages.
Three patterns stand out.
- Children start about equal. Boys and girls both sat near 62% between 3 and 10 years.
- Girls drop during puberty. The same paper reports that female body water percentage fell to about 55% by the teen years and then stayed close to that through the working years.
- Everyone drifts lower after 60. Men fell to about 57% and women to about 50% in the oldest group.
The authors also report that overweight participants of both sexes had a lower body water percentage than normal-weight participants. That is a statement about averages in a study. It says nothing about any one person and it is no reason to feel bad about a number.
Is there a normal range for body water?
A narrow normal range for each person does not exist. What exists is a typical band for each age and sex, as the table shows. For a healthy adult man the band in this study is close to 62%, and for a healthy adult woman it is close to 55%. A reading a few points either side is common and not a warning on its own.
Charts like this are references. They do not diagnose anything. A body water reading cannot tell you whether you have a kidney, heart or hormone problem, and a scale cannot tell you that either. A doctor decides that, using blood and urine tests and an examination.
This is general information. Ask your doctor about your own readings.
How a laboratory measures total body water
The reference method is dilution. A person drinks a small dose of deuterium, a harmless heavier form of hydrogen, and the lab tracks how far it spreads through body fluid. A 1992 paper in Annals of Human Biology used this method to study body water in old age. It reported large differences between individuals in how much water their lean tissue held, which is why one average cannot describe everybody.
This takes time and a specialist lab. It is a research and clinical tool, not something you do at home.
How a body composition scale estimates it
A body composition scale gives a quicker answer, and the answer is an estimate. Total body water is one of the figures such scales can show beside body fat and muscle. Being an estimate, it carries an error that a lab measurement does not. Our posts on how a smart scale measures body fat and whether smart scales are accurate go into that method and its limits.
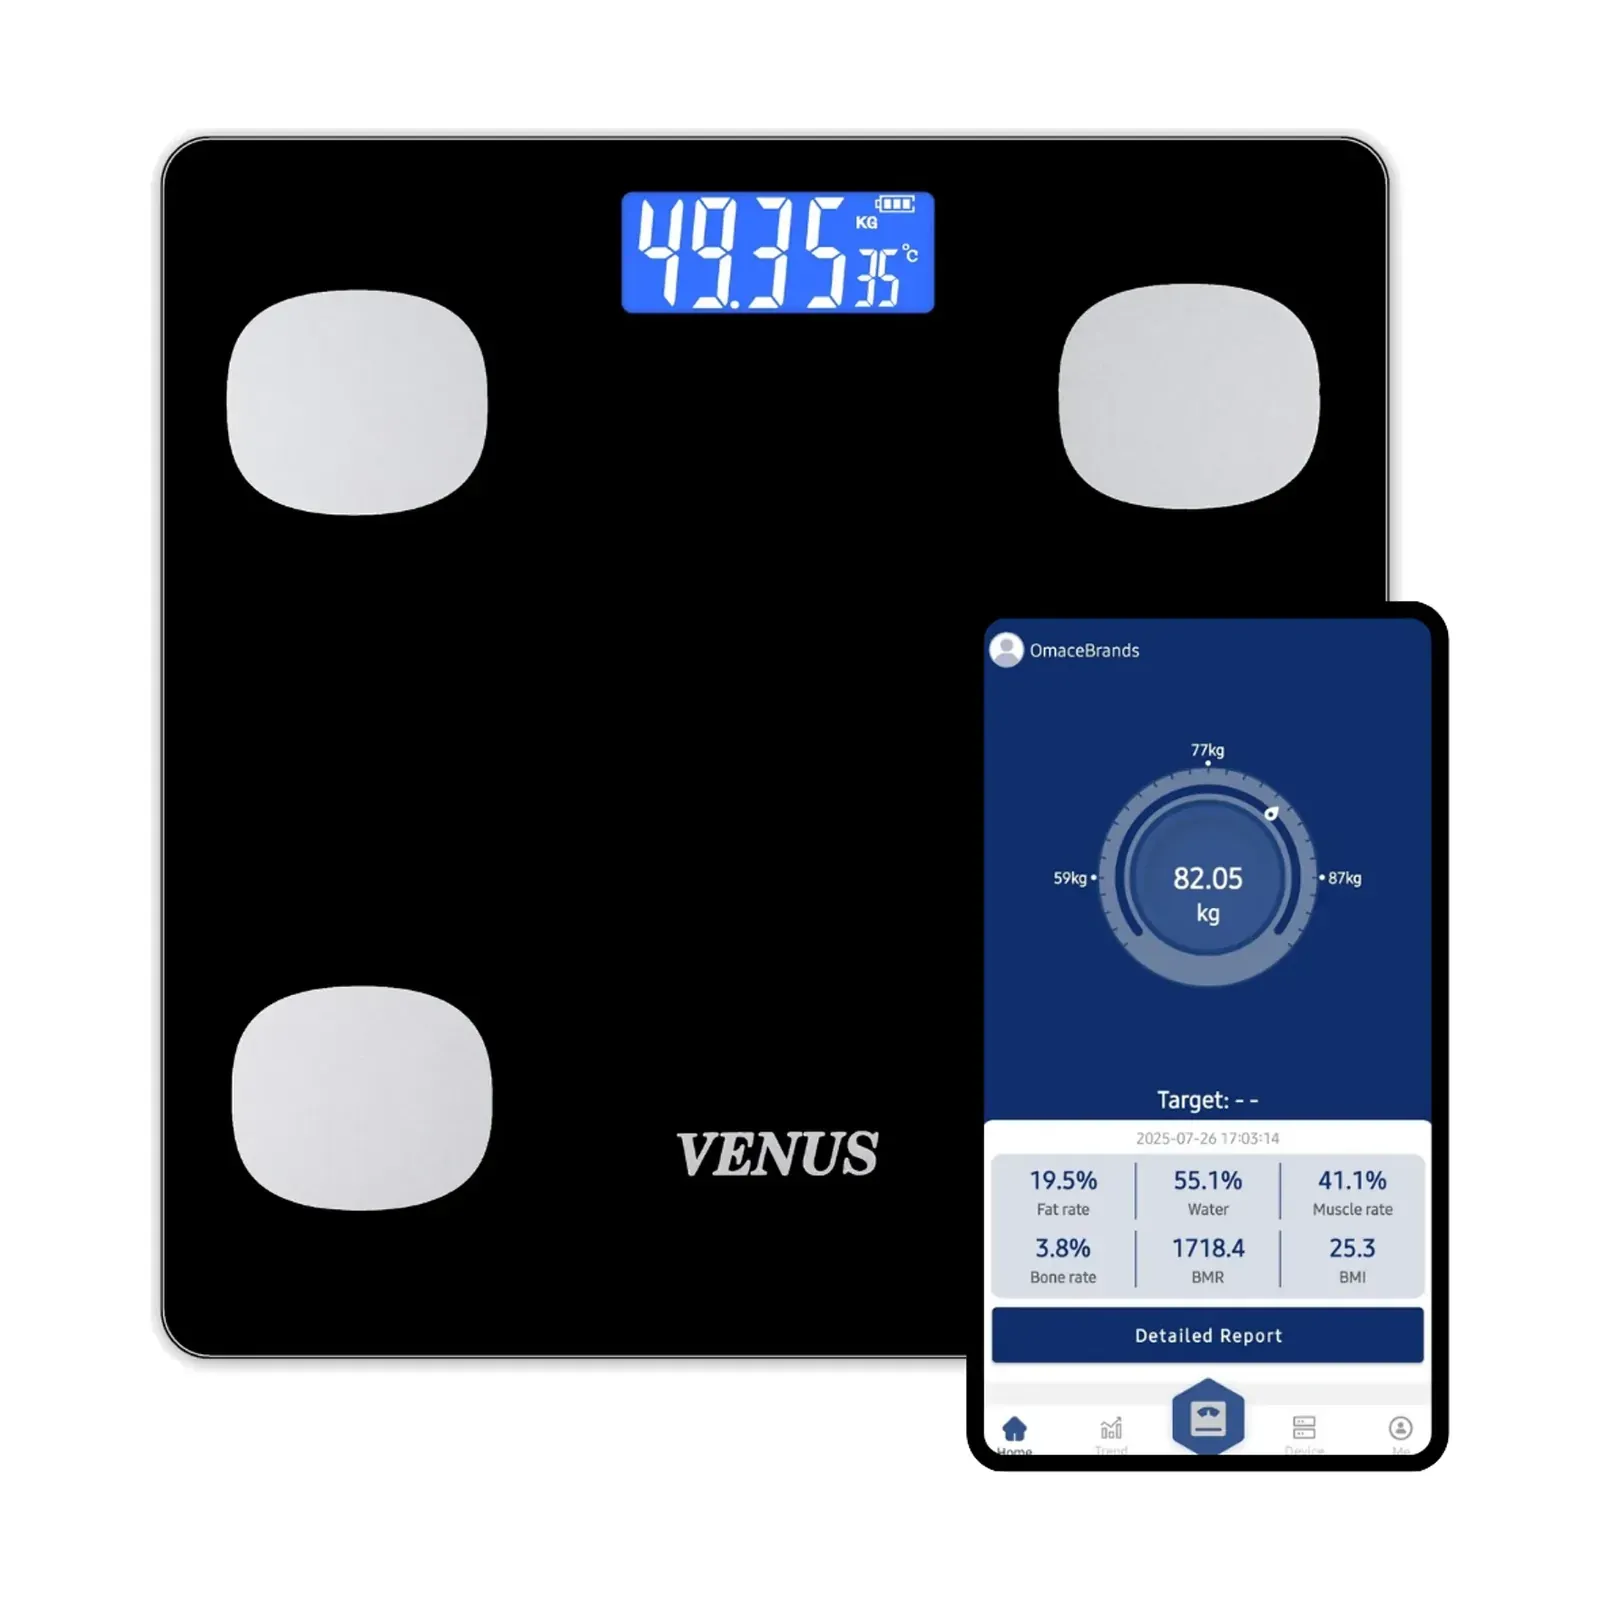
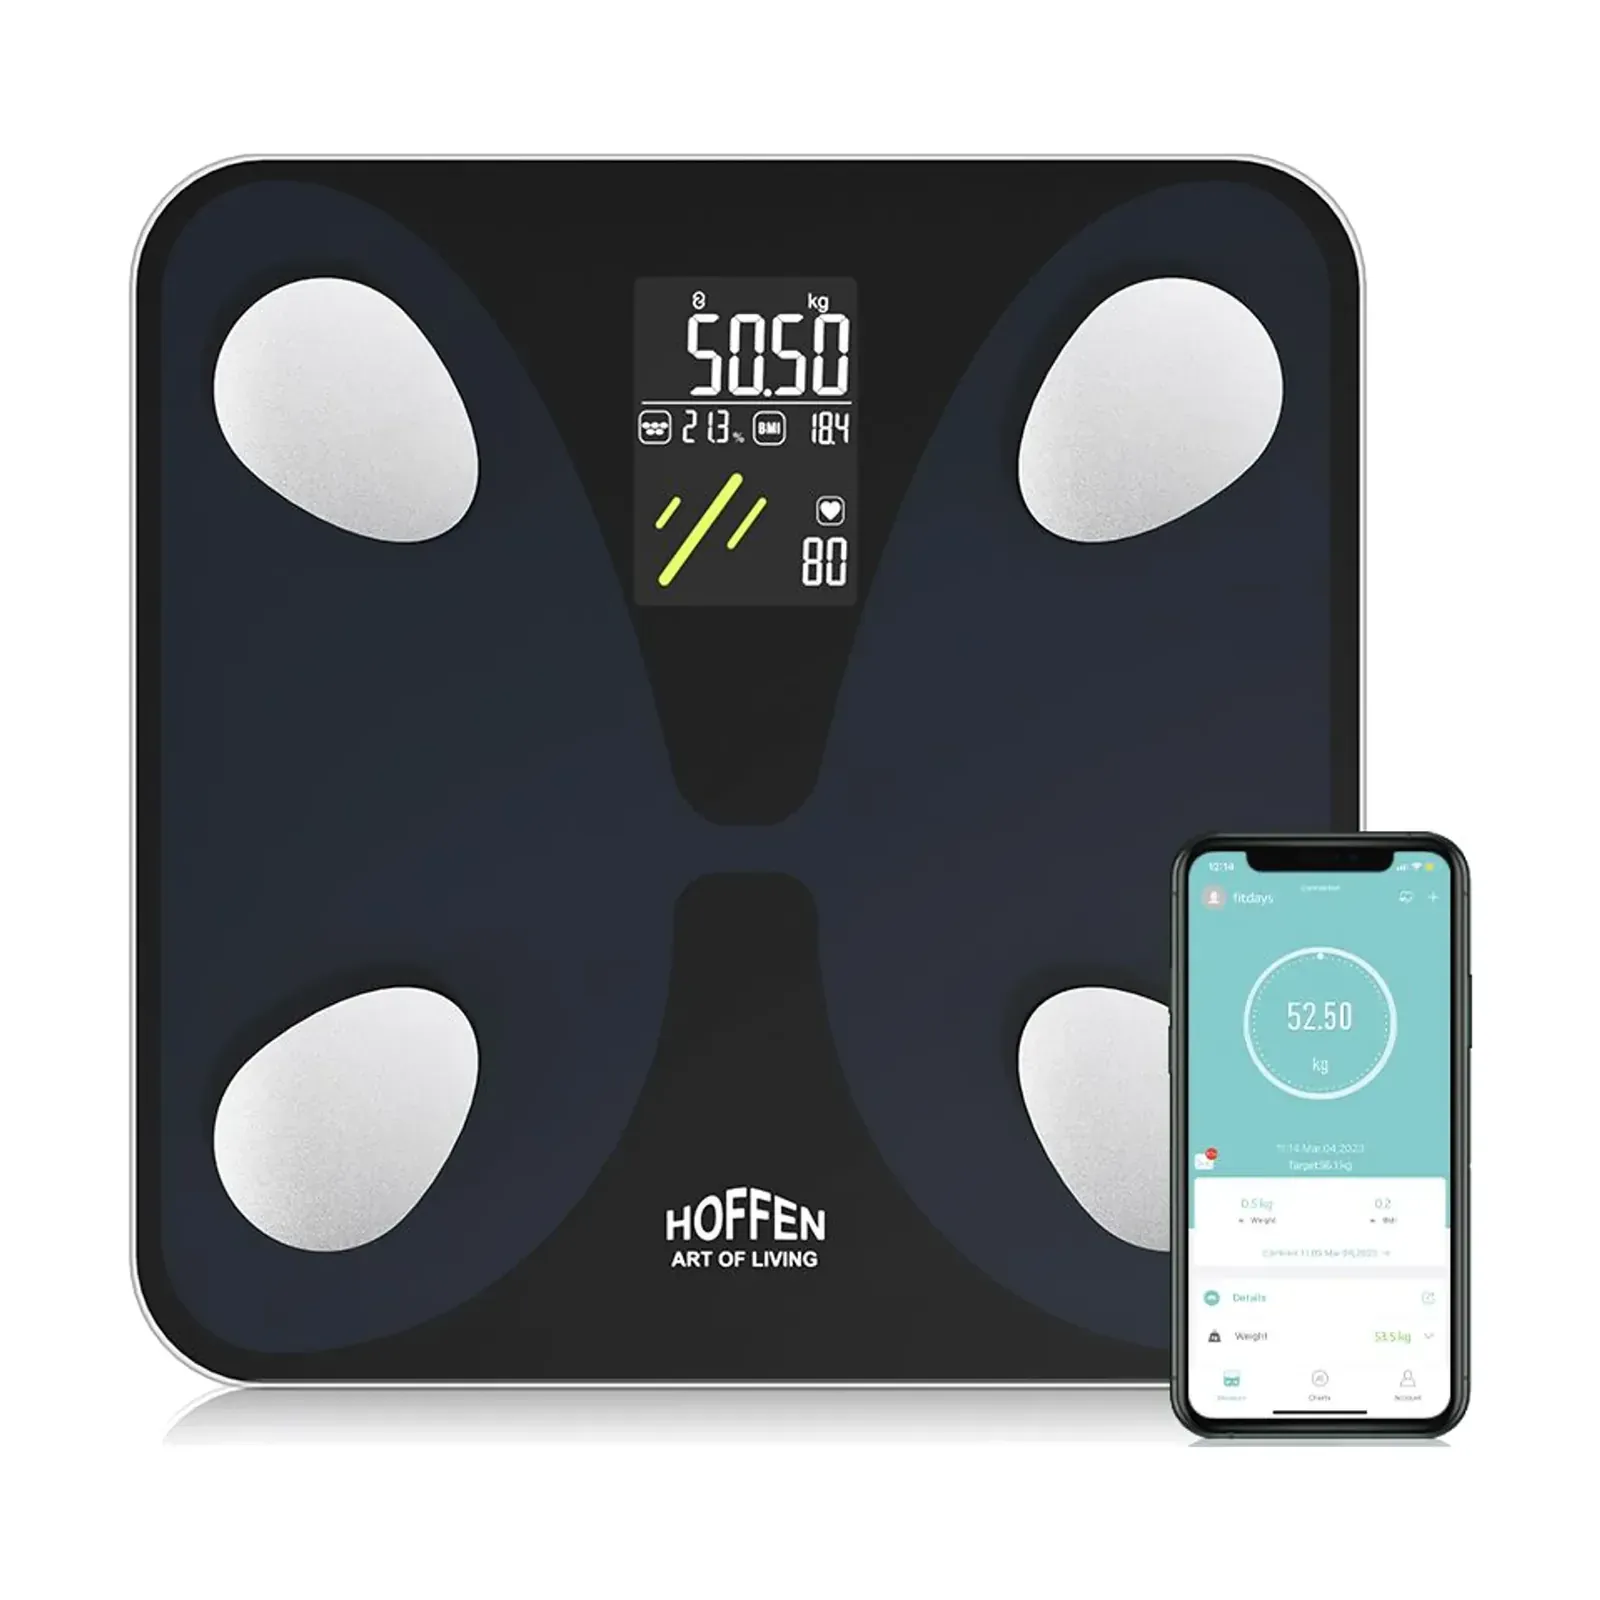
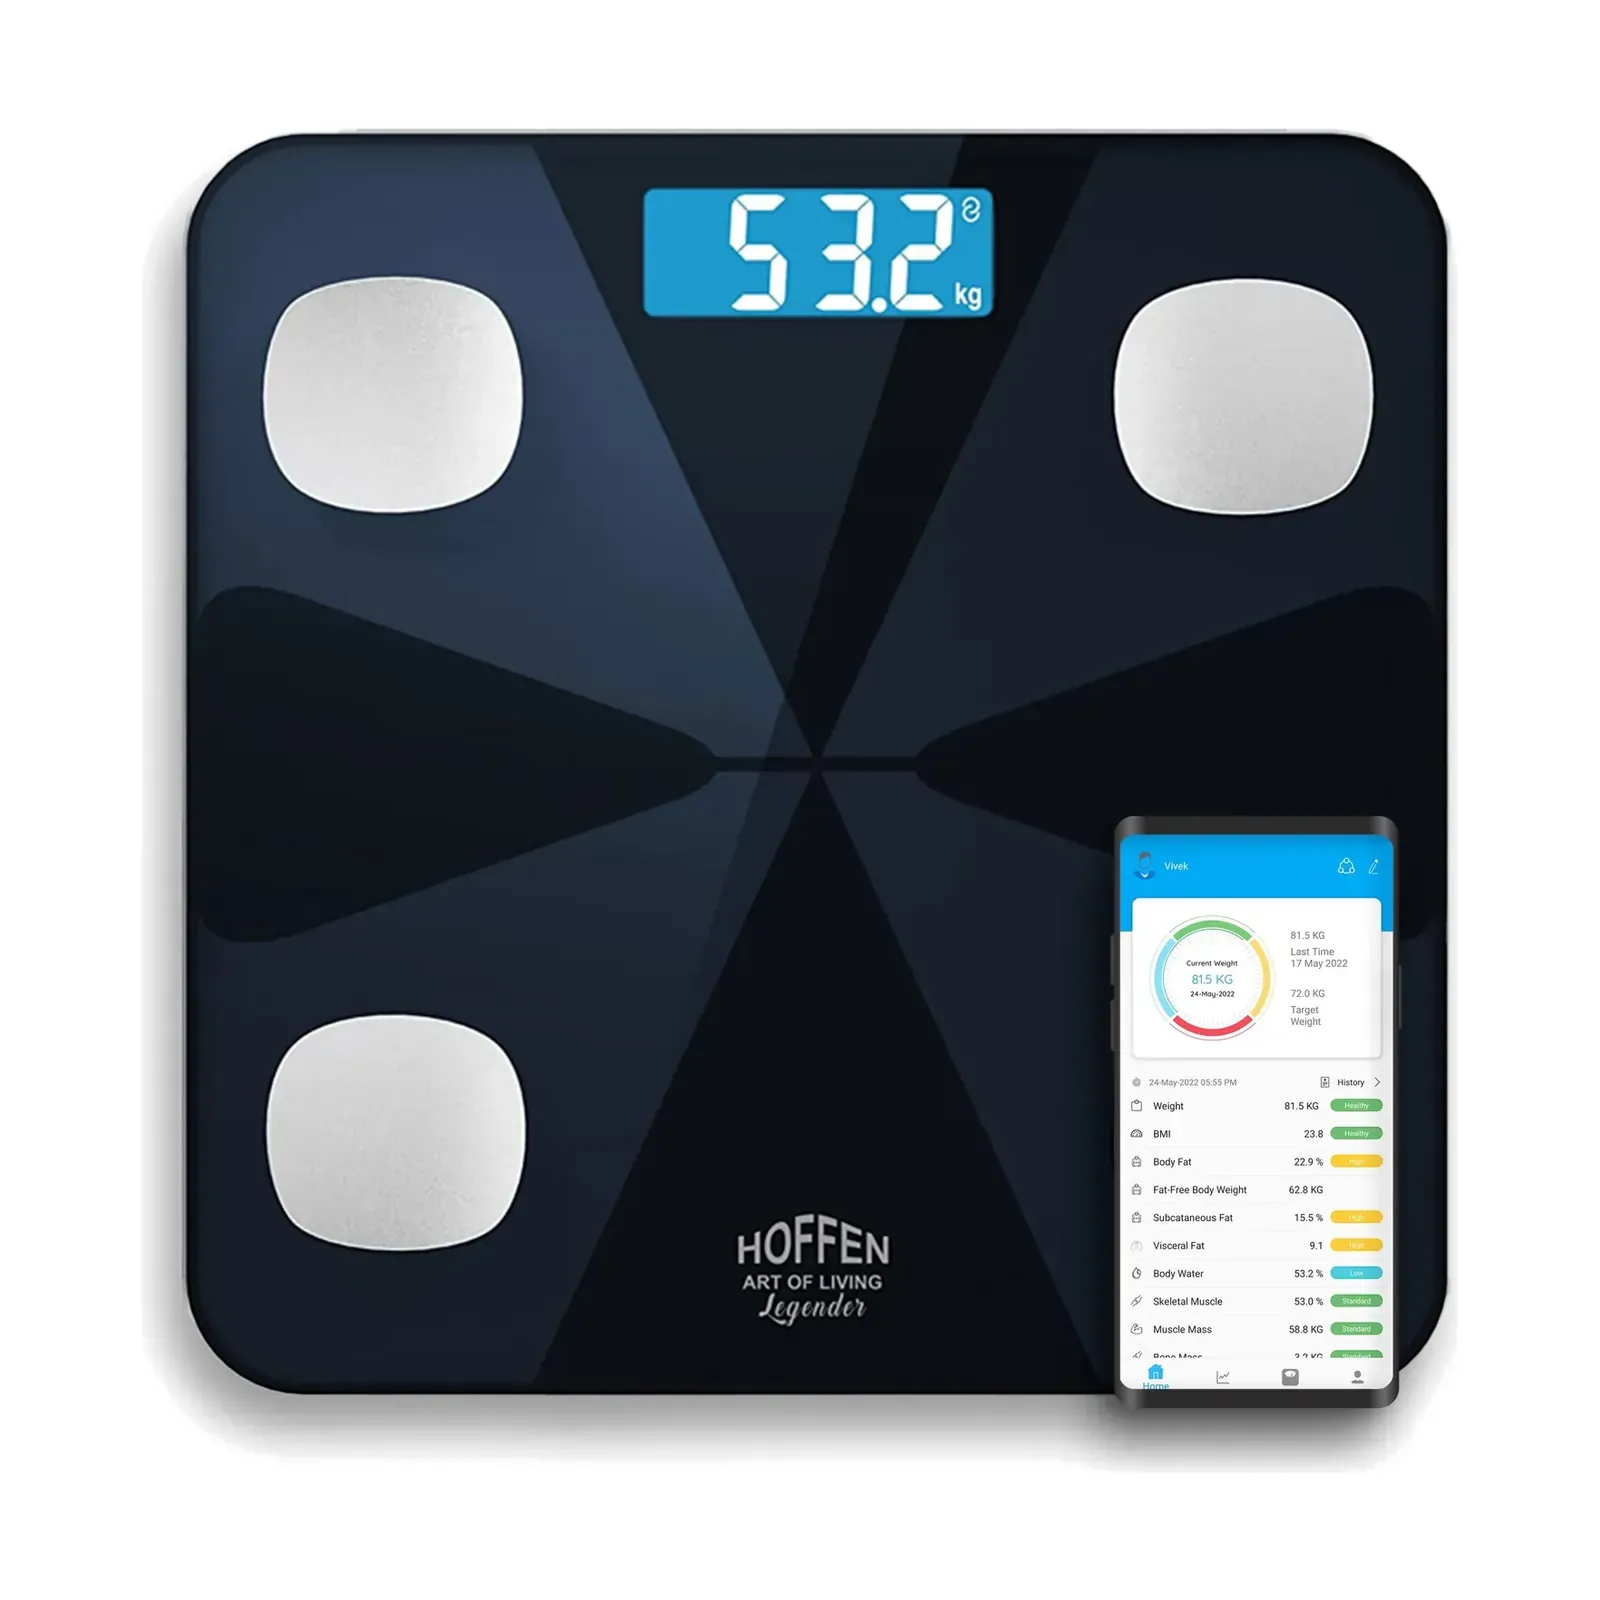
Omace Brands Private Limited makes smart body scales in Bagru, Jaipur. The product pages of the Venus EPS-6399 Body Fat Weighing Machine at ₹729, the Hoffen HO-19 Bluetooth Weighing Scale, the Hoffen HO-36 Body Fat Analyzer Scale, the Hoffen HO-45 Smart Body Composition Scale and the Hoffen HO-18 Weight Machine with App list body water among their readings. The ultrasonic height and weight machine lists it too. A body water figure on any of them is an estimate for tracking your own trend, and it is not a medical test.
Why the reading changes during the day
Body water is not fixed. Your weight itself moves by a kilogram or more across a day, and a lot of that is water.
A 2020 study in the Libyan Journal of Medicine shows how easily the estimate shifts. It tested 140 healthy adults on a foot-to-foot impedance scale. Each person drank 500 mL of water four times, and the scale was read 15 minutes after each drink. Yet the scale read body fat higher and body water lower after the drinks, although the water had only been drunk and not added to the body's tissue. The authors say these effects should be kept in mind when such readings are used in health care.
A separate paper by O'Brien, Young and Sawka in the International Journal of Sports Medicine reached a similar view. It reports that shifts in fluid and salts can change the impedance reading on their own. The authors conclude that current methods may not give valid estimates of total body water when hydration is altered.
In everyday life, these are the common reasons your number moves.
- Drinking. A big glass or two just before stepping on can change the estimate, as the study above shows.
- Sweating after exercise. You lose fluid, and the balance of water and salts in the body changes too.
- A meal. Food and fluid in the gut add weight and affect how the body is read, so a morning reading before breakfast stays easier to compare.
- A bath or a hot day. No source we checked tests a bath on its own, but wet skin, heat and sweat are the same kind of change in fluid and skin condition.
- Illness and heat. Fever, loose motions and long hours in summer heat all pull water out.
How to take a more comparable reading
You cannot remove the error, but you can keep your own readings comparable with each other. The aim is the same conditions each time, not a perfect number.
- Weigh at the same time of day, such as the first thing in the morning after using the toilet.
- Do not step on right after a big drink, a meal or a workout.
- Stand on a hard, flat floor with bare, dry feet.
- Look at the trend over several weeks, not one reading.
- Keep the same scale and the same user profile (age, height, sex) in the app or settings.
If you only want to know your weight, a plain bathroom scale is enough. The smart weighing scale range is for people who also want the extra estimates. Your BMI is a separate measure and does not tell you anything about body water.
Is body water the same as being hydrated?
No. A body composition scale cannot see whether you are dehydrated, and the review above says its estimate may not be valid when hydration changes.
The NHS page on dehydration gives the simple signs to watch. It advises drinking enough that your urine is pale. It lists thirst, headache, light-headedness, dark and strong-smelling urine, passing urine less often than usual, tiredness and a dry mouth among the signs of dehydration. Babies may have fewer wet nappies. Serious cases need medical attention.
Those signs tell you more about your fluid balance today than a body water percentage will.
Lean mass, fat and body water together
Muscle and other lean tissue carry a lot of water, so body water and lean mass tend to move together on a scale. Our post on lean body mass explains that link and gives a body fat chart. The 2018 paper cited above also found that fat-free mass fell with age while body fat percentage rose, which fits the drift in body water with age.
Do not turn any of this into a goal. A higher or lower figure than the table is not a score, and the goal of a home reading is to notice change over time while you stay in touch with your doctor.
Reading your number sensibly
Compare your reading to the averages in the table, then compare it with your own earlier readings. If the figure is far from the table for your age and sex, test again on a different morning before you worry. If it stays far off and you also feel unwell, tired or swollen, see a doctor and take your readings along.